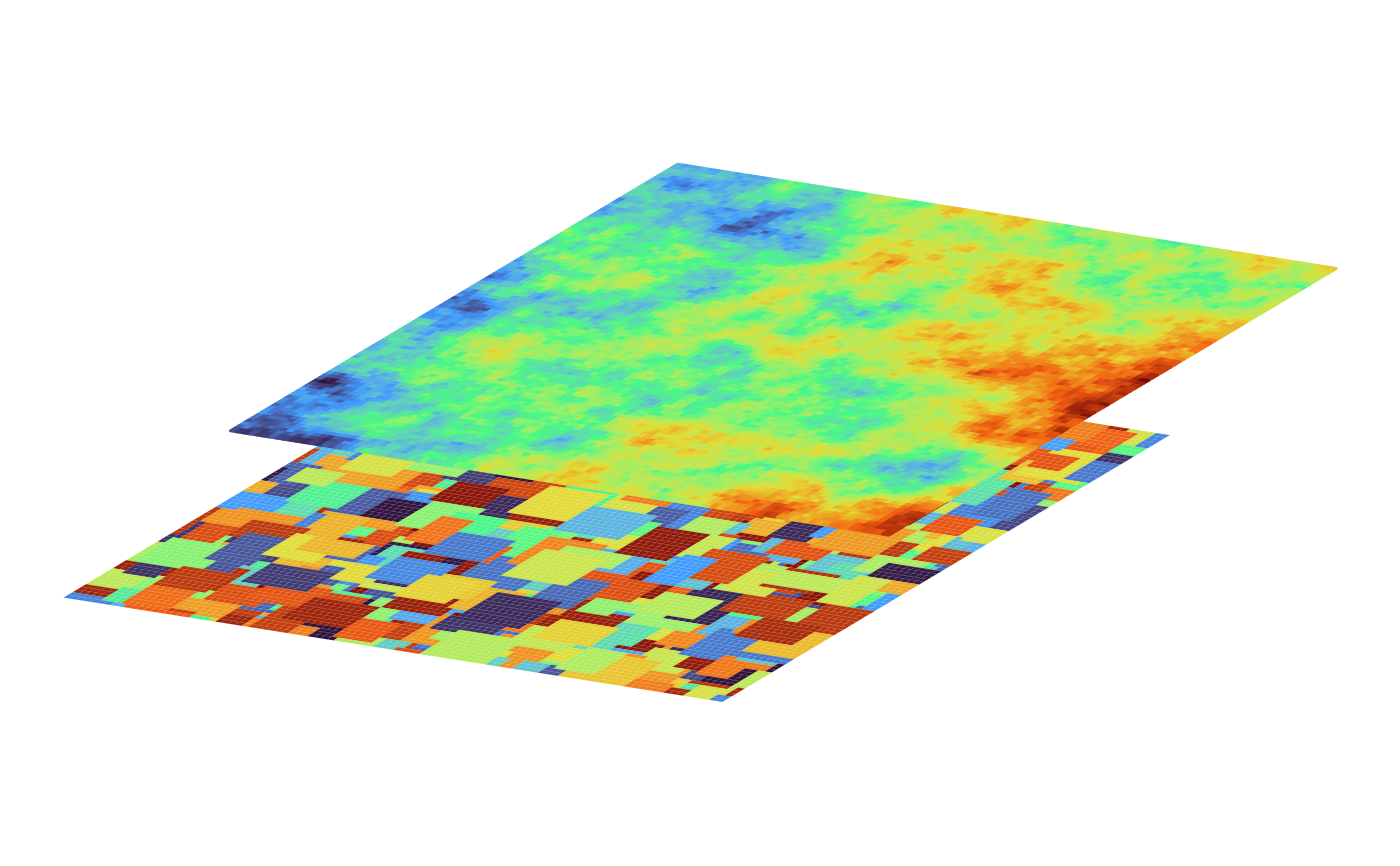
Takes tilted maps and plots them with ggplot.
Usage
plot_tiltedmaps(
  map_list,
  layer = NA,
  palette = "viridis",
  color = "grey50",
  direction = 1,
  begin = 0,
  end = 1,
  alpha = 1
)
Arguments
- map_list
sf or terra/stars/raster object.
- layer
vector or list of names of each column in tilted sf object that should be used for coloring
- palette
vector of palettes provided by the viridis and scico packages for rasters
- color
a single color applied multiple times or a vector of color strings for points or linestrings
- direction
vector of directions for viridis and scico color palettes
- begin
vector of the of the start of interval the palette to sample colours from for viridis and scico color palettes
- end
vector of the of the end of interval the palette to sample colours from for viridis and scico color palettes
- alpha
vector of opacity for viridis and scico color palettes